
Figure 1.
- ID
- ZDB-FIG-210904-16
- Publication
- Yan et al., 2021 - Single-cell imaging of T cell immunotherapy responses in vivo
- Other Figures
- All Figure Page
- Back to All Figure Page
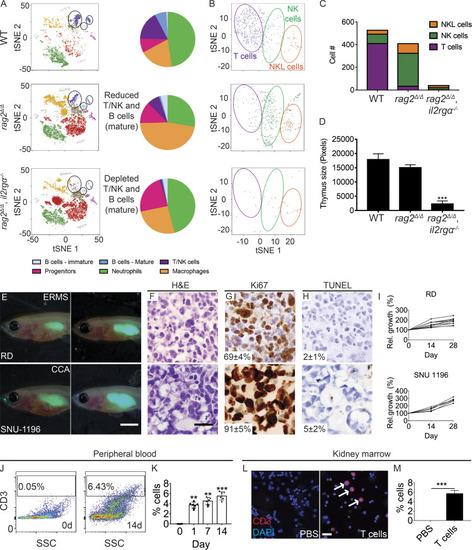
rag2Δ/Δ, il2rga −/− zebrafish have reduced T, B, and NK cells and efficiently engraft human cancer and T cells. (A) tSNE visualization and quantitation of single-cell RNA sequencing of the adult kidney marrow. WT, n = 4,654 cells; rag2Δ/Δ, n = 9,418 cells; and rag2Δ/Δ, il2rga−/−, n = 8,790 cells (n = 3 fish/genotype). (B and C) tSNE visualization subclustering (B) and quantification (C) of T, NK, and NK-lysin+ (NKL) cells within the marrow. (D) Histological analysis of thymus size (n = 5 fish/genotype). (E) Representative images of EGFP+ RD embryonal RMS (ERMS) and SNU-1169 cholangiocarcinoma (CCA) cells just after engraftment (0 dpt, left) and at 28 dpt (right). SNU-1169 failed to efficiently engraft into previous immune-deficient zebrafish models. (F–H) Histology showing H&E (F), Ki67 (G), and TUNEL (H) staining. n ≥ 3 fish/tumor type. (I) Kinetics of tumor growth following successful engraftment. (J–M) Human CD8+ T cells engraft into rag2Δ/Δ, il2rga−/− zebrafish. Flow cytometry analysis of peripheral blood before (left, J) and 14 d after engraftment (right, J). Quantification of human T cells in the peripheral blood (n = 5 fish per time point; K). CD3 immunofluorescence staining of kidney marrow cytospins (CD3+ cells are red and denoted by arrows; DAPI nuclei staining blue; L) and quantification at 14 d after engraftment (n = 6 fish/experimental condition; M). Scale bar equals 0.25 cm (E), 50 µm (F–H), and 10 µm (L). Error bars denote ±SD. **, P < 0.01; ***, P < 0.001, Student's t test compared with controls. Rel., relative; SSC, side scatter. |
| Fish: | |
|---|---|
| Observed In: | |
| Stage: | Adult |