
Figure 1.
- ID
- ZDB-FIG-210902-10
- Publication
- Scott et al., 2021 - In Vivo Characterization of Endogenous Cardiovascular Extracellular Vesicles in Larval and Adult Zebrafish
- Other Figures
- All Figure Page
- Back to All Figure Page
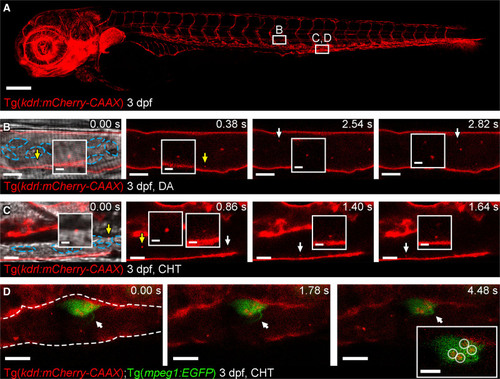
Figure 1. Cell-type specific extracellular vesicle (EV) labeling strategy and live imaging in the peripheral circulation.A, Overview image of a Tg(kdrl:mCherry-CAAX) fish at 3 dpf. All endothelial cells are labeled with mCherry. The boxed areas define the regions shown in the image sequence in B, C, D. B, Image sequence of mCherry+ endothelial cell (EC)-EVs moving through the dorsal aorta (DA; arrows and inset). The resolution of light-based detection methods limits our ability to accurately determine the size of endogenous EVs during live imaging. C, Image sequence of mCherry+ EC-EVs moving through the caudal hematopoietic tissue (CHT; arrows and inset). D, Image sequence of a macrophage (green) in the CHT of a Tg(kdrl:mCherry-CAAX);Tg(mpeg:EGFP) fish at 3 dpf, a macrophage protrusion moves toward the cell body (arrows) and intracellular compartments contain mCherry+ EC-EVs (circled in inset). The blue dashed lines in B, C demark blood cells. The white dashed line in D demarks the endothelium. Anterior is to the left. Scale bars: A, 200 μm; B and C, 5 μm; insets in C, 2 μm; D, 10 μm; insets in D, 5 μm. |