|
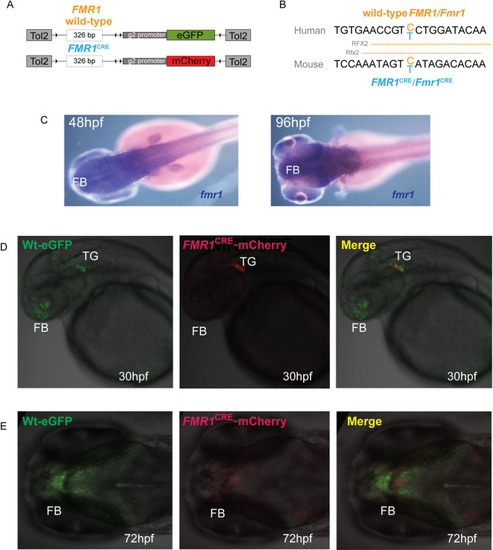
<italic toggle='yes'>FMR1</italic><sup xmlns:xlink='http://www.w3.org/1999/xlink'>CRE</sup> alters enhancer function in the zebrafish brain.(A) A diagrammatic summary of the dual color fluorescence assay plasmid constructs used in this study. The size of the human FMR1 element is provided in base pairs (bp) (B) Human and mouse (FMR1CRE/Fmr1CRE) sequences are shown with the variant base marked in blue, resulting in predicted loss of a RFX2/Rfx2 binding site in FMR1CRE/Fmr1CRE. (C) mRNA in situ hybridization showing expression of fmr1 in forebrain and midbrain during embryonic development in wild-type zebrafish. (D-E) Dual color fluorescent transgenic assay in zebrafish with wild-type (Wt) and mutant FMR1CRE driving eGFP and mCherry expression respectively. Loss of enhancer activity is observed in forebrain with the mutant FMR1CRE allele. Further examples of embryos for different stable lines are shown in S35 Fig in S1 File. FB: Forebrain; MB: Midbrain; TG: Trigeminal ganglia; NP: hpf: Hours post fertilization.
|