
Figure 4
- ID
- ZDB-FIG-210801-72
- Publication
- Chuang et al., 2021 - Oxytocin Signaling Acts as a Marker for Environmental Stressors in Zebrafish
- Other Figures
- All Figure Page
- Back to All Figure Page
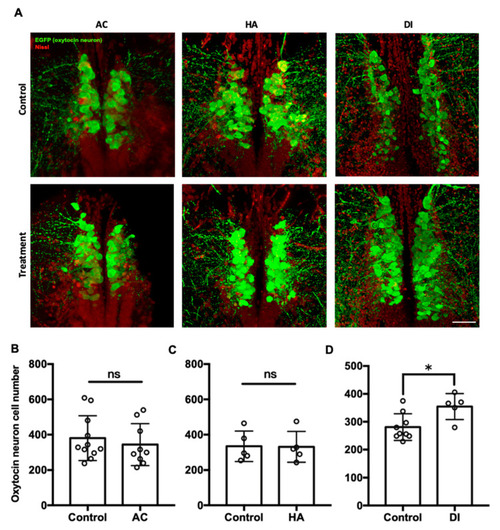
Confocal laser scanning micrographs of the sections of the brain of transgenic zebrafish (oxtl:EGFP) acclimated to AC, HA, or DI water stained with anti-GFP (green; oxytocin) and Nissl (red) (A). Scale bar = 50 µm. The total numbers of oxytocin neurons in the brain of transgenic zebrafish treated with AC (B), HA (C), and DI (D) water were counted through the section sets from whole brain. Each circle represents the data from one single fish. In AC treatment, n = 11 for control group; n = 9 for the treatment group. In HA treatment, n = 5 for both control and treatment group. In DI treatment, n = 9 for control group; n = 5 for the treatment group. The asterisks (*) indicate significant differences between the control and treatment groups; ns indicates that no significant difference was found between the control and treatment groups. Values are mean ± SD (p < 0.05 (Student’s t-test)). |