
FIGURE
Figure 9
Figure 9
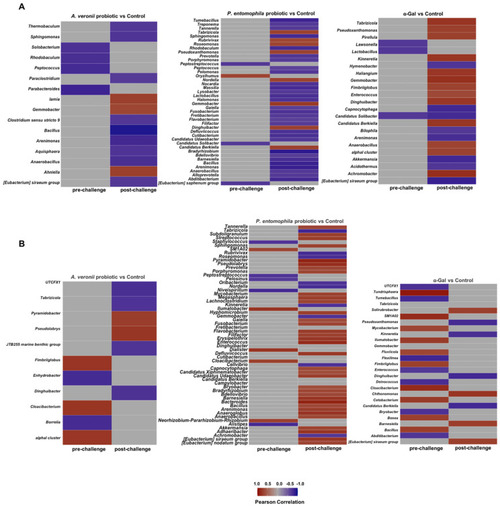
Correlation between zebrafish gut microbiota and antibody response. Heatmaps of the significantly correlated taxa with (A) anti-α-Gal and (B) anti-P22 IgM titers for each experimental group and at each stage (pre-challenge, post-challenge). Pearson correlations between zebrafish gut microbiota and anti-α-Gal and P22 IgM antibody titers were calculated with ALDEx2, using the aldex.corr function analysis, as implemented in R. |
Expression Data
Expression Detail
Antibody Labeling
Phenotype Data
Phenotype Detail
Acknowledgments
This image is the copyrighted work of the attributed author or publisher, and
ZFIN has permission only to display this image to its users.
Additional permissions should be obtained from the applicable author or publisher of the image.
Full text @ Pharmaceuticals (Basel)