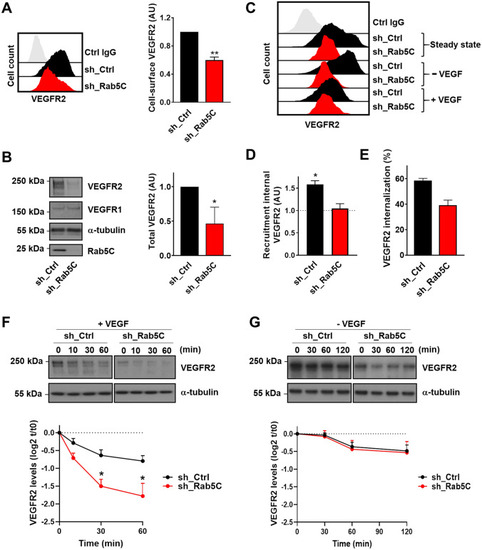
Rab5C protects endosomal VEGFR2 from VEGF-induced lysosomal degradation. a Cell-surface levels of VEGFR2 in sh_Ctrl and sh_Rab5C HUVECs analyzed by flow cytometry. (left) Histograms of a representative experiment, (right) quantification (means + SEM) of 4 independent experiments. Mean fluorescence intensities are expressed relative to those in sh_Ctrl cells. b Western blot analysis (left) of sh_Ctrl and sh_Rab5C HUVEC lysates probed for VEGFR2 and VEGFR1, with α-tubulin serving as a loading control. Blots are representative of 3 independent experiments. Quantification (right) shows the relative VEGFR2 levels normalized to total protein content. Levels in sh_Ctrl cells were set to 1. Results are means + SEM of 3–4 independent experiments. c sh_Ctrl and sh_Rab5C HUVECs were starved for 30 min and then either left untreated or stimulated for 30 min with 50 ng/ml VEGF, whereafter the cell-surface levels of VEGFR2 were analyzed by flow cytometry. d Recruitment of VEGFR2 upon starvation was calculated as the increase in surface levels with respect to those in steady-state. Results are means + SEM of 3 independent experiments. e VEGF-induced VEGFR2 internalization was calculated for sh_Ctrl and sh_Rab5C HUVECs. Mean fluorescence intensities were normalized to steady-state levels. Results are means + SEM of 3–4 independent experiments. f, g HUVECs were starved overnight and subsequently stimulated with 50 ng/ml VEGF (f) or maintained in starvation medium for the indicated times (g). Lysates were subjected to Western blot analysis for VEGFR2, with α-tubulin as a loading control. Blots are representative of 4–5 individual experiments. Quantification of Western blots shows the decline in VEGFR2 levels, expressed relative to the levels at t = 0. Values represent means + SEM of 4–5 independent experiments
|
