|
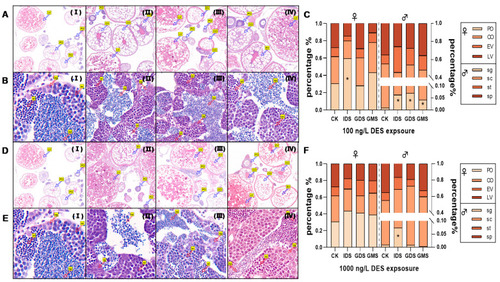
(A,B) are tissue slices from zebrafish exposed to 100 ng/L DES, (D,E) are tissue slices for 1000 ng/L DES. I–IV stand for different exposure groups (control, IDS, GDS and GMS, respectively). Percentages of egg cells and sperm cells in different development stages in females and males at 90 dpf in (C) (100 ng/L) and (D) (1000 ng/L), respectively. (C) and (F) are percentage of eggs cells and sperm cells exposed to 100 ng/L and 1000 ng/L, respectively. Values are shown as mean (n = 3 replicates per treatment, n = 2 fish per gender of each replicate with 2 cross sections). Asterisks denote significant differences between control and treatments (* p < 0.05, according to Dunnett’s test).LV: late vitellogenesis oocytes; EV: early vitellogenesis oocytes; CO: cortical granular oocytes; PO: perinuclear oocytes; sp: spermatogonia; sc: spermatocytes; st:spermatids; sp: sperm.
|