
FIGURE
FIGURE 5
- ID
- ZDB-FIG-210716-40
- Publication
- Dong et al., 2021 - An Integrated Strategy for Rapid Discovery and Identification of Quality Markers in Gardenia Fructus Using an Omics Discrimination-Grey Correlation-Biological Verification Method
- Other Figures
- All Figure Page
- Back to All Figure Page
FIGURE 5
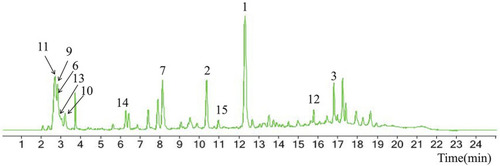
TICs of GF compounds at a negative ion mode. The total ion chrtograms (TICs) of GF extract, 1, 2, three on behalf of geniposide, genipin-1-β-D-gentiobioside, crocin-1, respectively; 6,7 and 9–15 represent quinic acid, gardenoside, |
Expression Data
Expression Detail
Antibody Labeling
Phenotype Data
Phenotype Detail
Acknowledgments
This image is the copyrighted work of the attributed author or publisher, and
ZFIN has permission only to display this image to its users.
Additional permissions should be obtained from the applicable author or publisher of the image.
Full text @ Front Pharmacol