
Figure 6
- ID
- ZDB-FIG-210708-10
- Publication
- Yang et al., 2021 - Zebrafish behavior feature recognition using three-dimensional tracking and machine learning
- Other Figures
- All Figure Page
- Back to All Figure Page
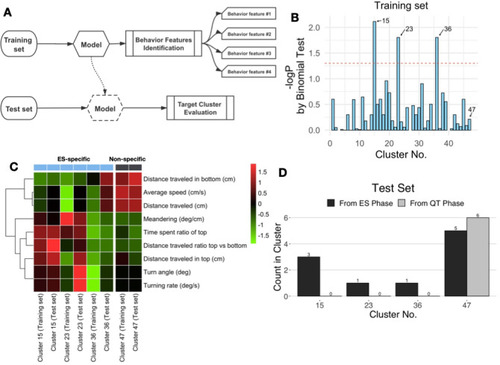
Behavioral features identified by machine learning. (A) Correlations between the cluster of behavior features and treatment of the optimal parameter values found by grid search (shown in Fig. 4) in 5 s time segment behavior. Cluster no. 45 was significantly associated with treatment (ES phase); cluster no. 48 was significantly associated with no treatment (QT phase). The cluster identifier number is shown on the x-axis, and -log p-values are indicated on the y-axis. The horizontal red dashed line shows a p-value of 0.05 by binomial test (the probability of correlation was not significantly different from 0.5 for each of the clusters). (B) Exploratory behavioral profiles of zebrafish between cluster no. 45 (ES phase) and cluster no. 48 (QT phase), which were newly identified by the clustering analysis. (C) Reconstruction and visualization of the 3D swim path of adult zebrafish between cluster no. 45 (ES phase) and cluster no. 48 (QT phase). Because of the limitation of the picture size, only 9 motion tracks in each behavior feature are displayed. Data are shown as the mean ± SEM for zebrafish (n = 10, Student's t-test), with p < 0.05 and p < 0.01 represented by * and **, respectively. |