
Figure 4
- ID
- ZDB-FIG-210615-4
- Publication
- Li et al., 2021 - Generation of GCaMP6s-Expressing Zebrafish to Monitor Spatiotemporal Dynamics of Calcium Signaling Elicited by Heat Stress
- Other Figures
- All Figure Page
- Back to All Figure Page
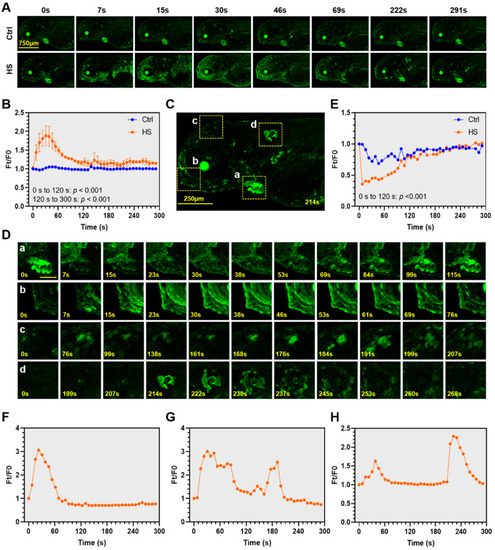
Spatiotemporal dynamics of the heat-elicited Ca2+ signaling in zebrafish larvae. (A) Representative time-lapse confocal microscope images illustrating dynamics of the heat-elicited Ca2+ signaling. E3 medium preconditioned at 28 °C was added to the control (Ctrl), while heat shock (HS) was exerted by adding E3 medium at 40 °C. The time points at which the images were taken are shown above the corresponding images. (B) Overall GCaMP6s fluorescence dynamics upon heat stress. The y-axis indicates the ratio of fluorescence intensity at different time points (Ft) to that before heat shock (F0). The x-axis indicates time duration under heat stress. Data are shown as mean ± standard error (n = 3). (C) A magnified image indicates the organs and regions (enclosed by dashed rectangles) demonstrating marked changes in GCaMP6s fluorescence upon heat stress. (a), heart; (b), region around the mouth protruding; (c), region above the eye; (d), a neuromast-like structure. (D) Magnified images of the organs and regions marked in (B). The scale bar represents 200 μm. (E) Exposure to heat stress transiently decreased intracellular Ca2+ concentration in the heart of zebrafish larvae. (F–H) Line charts demonstrating fluorescence dynamics of the representative anatomical structures shown in (Cb–d). (F) Region around mouth protruding (Cb). (G) Region above the eye (Cc). (H) A neuromast-like structure (Cd). The measurements were repeated at least three times and representative results are shown. |