
FIGURE
Figure 11
- ID
- ZDB-FIG-210614-33
- Publication
- Guarin et al., 2021 - Spatiotemporal imaging and pharmacokinetics of fluorescent compounds in zebrafish eleuthero-embryos after different routes of administration
- Other Figures
- All Figure Page
- Back to All Figure Page
Figure 11
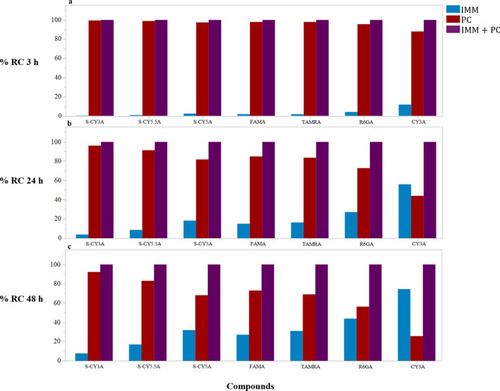
Histograms of Relative |
Expression Data
Expression Detail
Antibody Labeling
Phenotype Data
Phenotype Detail
Acknowledgments
This image is the copyrighted work of the attributed author or publisher, and
ZFIN has permission only to display this image to its users.
Additional permissions should be obtained from the applicable author or publisher of the image.
Full text @ Sci. Rep.