|
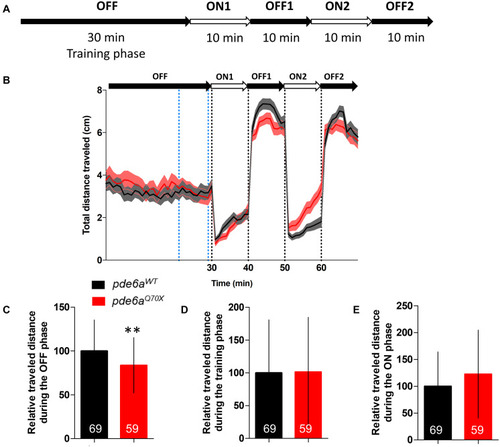
Analysis of the distance traveled by the larvae during the light/dark cycle in the VMR test at 5 dpf. (A) Sequence protocol: the activity is measured for 70 min, with 30 min of training in the dark (OFF), then 2 cycles of light/dark (ON/OFF) of 10 min each. (B) Average distance traveled per min for each condition according to the light/dark protocol. Distance traveled by the larvae during: (C) the averaged OFF1 and OFF2 phases; (D) the training phase [blue dotted lines in (B), between 21 and 29 min]; and (E) the averaged ON1 and ON2 phases. Distance were expressed as % of controls. Error bars represent the SD from three replicas except for B where errors bars represent the SEM. The number of animals is indicated within the columns. ∗∗p < 0.01.
|