
Fig. 4
- ID
- ZDB-FIG-210610-12
- Publication
- Huang et al., 2021 - Tanshinone I, a new EZH2 inhibitor restricts normal and malignant hematopoiesis through upregulation of MMP9 and ABCG2
- Other Figures
- All Figure Page
- Back to All Figure Page
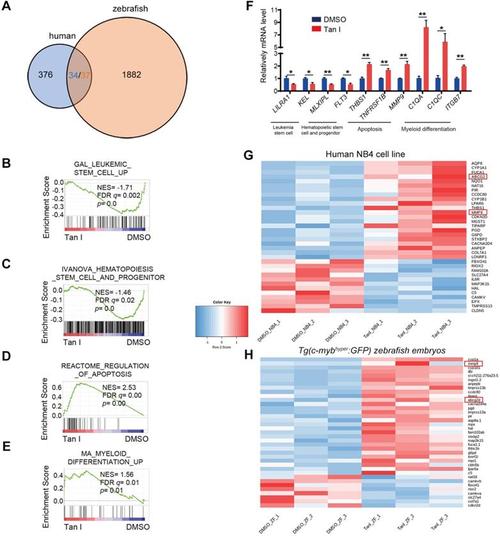
(A) Venn diagram showing the numbers of differentially expressed genes between DMSO and Tan I treated NB4 cell (blue) or Tg(c-mybhyper:GFP) zebrafish (orange), the overlapped gene number also shown (three of the human genes have two homologs each in zebrafish). (B-E) GSEA (Gene Set Enrichment Analysis) of the expressing profile of NB4 cells treated with DMSO or Tan I using a leukemia stem cell-associated upregulated signature (B), a hematopoietic stem cell and progenitor-associated signature (C), an apoptosis-associated signature (D) and a myeloid differentiation-associated upregulated signature (E). (F) RT-qPCR assay on the mRNA levels of a number of genes after treatments of NB4 cells with DMSO or 10 µM Tan I for 3 days. (G-H) Heatmap of 36 differentially expressed genes between DMSO and Tan I treatment in both human NB4 cell (G) and Tg(c-mybhyper:GFP) zebrafish (H). |