
Figure 2
- ID
- ZDB-FIG-210606-123
- Publication
- Valenzuela et al., 2021 - Intestinal Transcriptome Analysis Reveals Enrichment of Genes Associated with Immune and Lipid Mechanisms, Favoring Soybean Meal Tolerance in High-Growth Zebrafish (Danio Rerio)
- Other Figures
- All Figure Page
- Back to All Figure Page
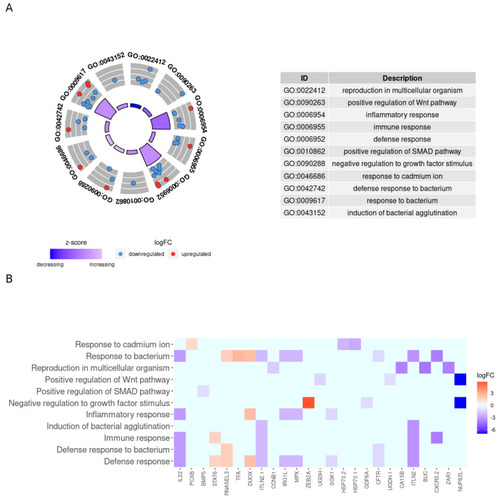
Enriched biological processes decreased in HG-50SBM + 2SPN fish and associated genes. (A) Circle plot of decreased biological processes in HG-50SBM + 2SPN fish. The red and blue dots on the gray ring represent the up- or downregulated genes, respectively, that participate in each process. The GO IDs of the biological processes are noted on the outer ring. The inner ring represents the z-score, and the color intensity indicates the degree to which the enriched biological process is decreased. The table on the right shows the name of each biological process by GO ID. (B) Heatmap of the 25 genes participating in biological processes decreased in HG-50SBM + 2SPN fish. Genes are presented as squares. Red indicates an upregulated gene, while blue indicates a downregulated gene. |