
Fig. 5
- ID
- ZDB-FIG-210525-19
- Publication
- Körholz et al., 2021 - Broad-Spectrum HDAC Inhibitors Promote Autophagy through FOXO Transcription Factors in Neuroblastoma
- Other Figures
- All Figure Page
- Back to All Figure Page
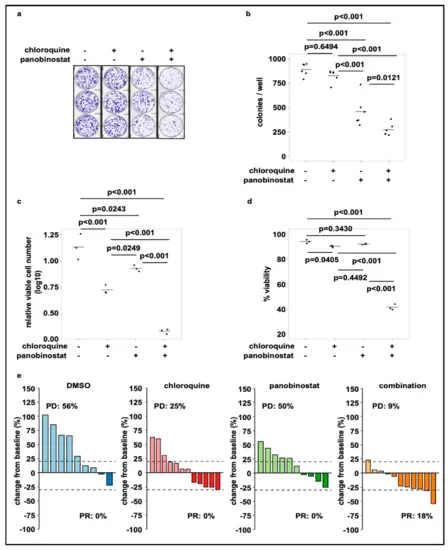
Treatment with panobinostat in combination with chloroquine reduces cell viability and colony growth. (a) Colony formation assay of SK-N-BE(2)-C neuroblastoma cells treated for 24 h with chloroquine (20 µM) or panobinostat (10 nM) alone or in combination. Shown are 6 technical replicates from two independent experiments. (b) Quantification of grown colonies after treatment of SK-N-BE(2)-C cells for 24 h with chloroquine (20 µM) or panobinostat (10 nM) alone or in combination. (c) Viable cell number (normalized to DMSO) of SK-N-BE(2)-C cells after 72 h treatment with chloroquine (20 µM) or panobinostat (10 nM) alone and in combination. (d) Viability of SK-N-BE(2)-C cells after 72 h treatment with chloroquine (20 µM) or panobinostat (10 nM) alone and in combination. (b–d) Statistical analyses: ANOVA with Tukey’s multiple comparison test. (e) Waterfall plots demonstrating change in tumor volume (%) for each individual xenograft, from baseline (day 1 = start of the treatment) to day 3 after yolk sac-implantation of SK-N-BE(2)-C cells. Dotted lines are drawn according to Response Evaluation Criteria in Solid Tumors (RECIST) 1.1 adopted for zebrafish tumors, to visualize best response: progressive disease (PD), at least a 20% increase in tumor volume; partial response (PR), at least a 30% decrease in tumor volume; each bar reflects one individual xenograft. The following concentrations were applied: chloroquine: 100 µM; panobinostat: 200 nM. |