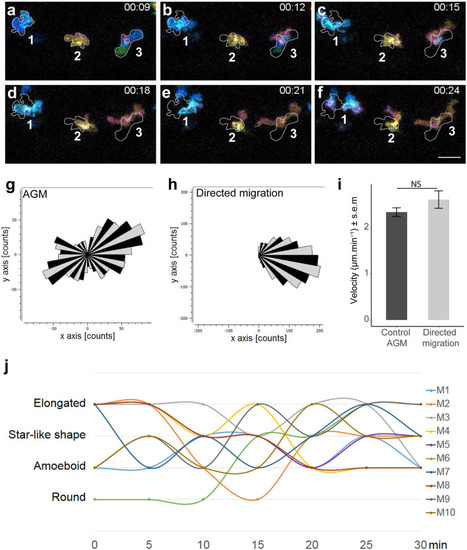
Macrophages in the AGM migrate in the mesenchymal way and undergo dynamic transition between different shapes over time. (a–f) Selected images from Video 1 illustrate the macrophage migration and shape transformation over time. Numbers point to individual macrophages. Time code is expressed in hours and minutes. White outlines on panel (b–f) indicate the shape and position of macrophages from panel (a) (9th minute). (g,h) Rose plot diagrams show the directionality of macrophage migration in the AGM compared to the oriented migration of macrophages in the tail region after tail fin cut injury. A diagram represents the single counts of the position of each macrophage in the selected area (black and grey sectors of angle π/18) every minute over 60 min with a (x,y 0,0) starting point. n = 23 macrophages for the control and n = 27 for directed migration. (i) Bar plot show the comparable velocity between macrophages in the AGM and macrophages migrating toward a cut in the tail region. NS not significant; bar plot was generated in R using ggplot2 package. (j) Graph showing the shape evolution of individual macrophages during a 30 min course with 5 min interval measurements. Every line represents a single macrophage (n = 10). See also Video 1. Scale bar (a–f) 30 µm. See also Supplementary Figure S1.
|
