
Fig. 2
- ID
- ZDB-FIG-210517-22
- Publication
- Baxendale et al., 2021 - The adhesion GPCR Adgrg6 (Gpr126): Insights from the zebrafish model
- Other Figures
- All Figure Page
- Back to All Figure Page
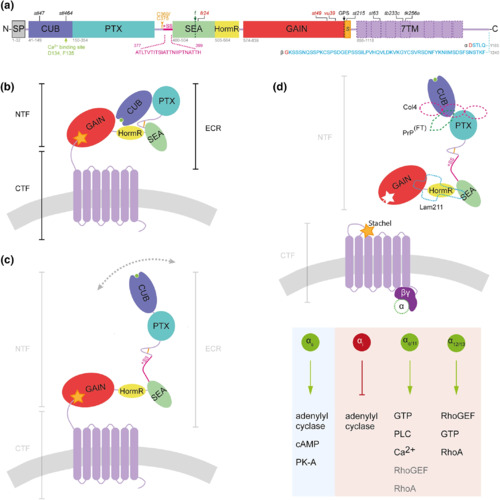
Schematic models of zebrafish Adgrg6 protein structure and mechanism of activation. (a) Zebrafish Adgrg6 protein sequence and domain organization, drawn to scale: signal peptide (SP), Complement C1r/C1s, Uegf, BMP1 (CUB), Pentraxin (PTX), Sperm protein, Enterokinase and Agrin (SEA), hormone receptor (HormR), GPCR autoproteolysis‐inducing (GAIN), Stachel sequence (S) and 7‐pass transmembrane (7TM, magenta) domains. The sequence of Adgrg6 splice isoforms is shown below the diagram: S1, including exon 6 (+SS, pink), and the short (α) and long (β) isoforms resulting from inclusion or exclusion, respectively, of exon 25 (amino acid sequence in blue; splice site in red). The two cysteine residues (C369, C375) that form a bond in the linker between PTX and SEA domain are shown in amber. Cleavage sites are highlighted by dotted lines: GPCR autoproteolytic site (GPS, black), and position of furin cleavage site in mammalian ADGRG6 (f, green). Positions of widely studied zebrafish mutations are shown above the diagram: truncating (nonsense) mutations in red; missense mutations in black. (b) Structure of Adgrg6 S2 isoform in closed conformation (not to scale). Domains correspond to those illustrated in (b); Ca2+ − binding site (green) within CUB domain, cell membrane (gray). (c) Structure of Adgrg6 S1 isoform in open conformation. (d) Overview of potential Adgrg6 Stachel activation mechanism (not to scale). Tethered Stachel sequence (amber star) self‐activates Adgrg6 following removal of NTF. The NTF is also thought to signal in trans (not shown). Known Adgrg6 NTF ligands (dashed shapes) include Collagen IV (pink, Col4), prion protein flexible tail (PrPFT, green), and Laminin‐211 (Lam211, turquoise). Signaling is transduced by various G protein α subunits activating intracellular pathways, elucidated from zebrafish Adgrg6 studies (light blue) and mouse or human ADGRG6 studies (light red). Diagrams are adapted from (Leon et al., 2020); the figure summarizes findings from this study and from (Geng et al., 2013; Küffer et al., 2016; Liebscher, Schön, et al., 2014; Lizano, Hayes, & Willard, 2021; Moriguchi et al., 2004; Paavola, Sidik, Zuchero, Eckart, & Talbot, 2014; Patra et al., 2013; Petersen et al., 2015) |