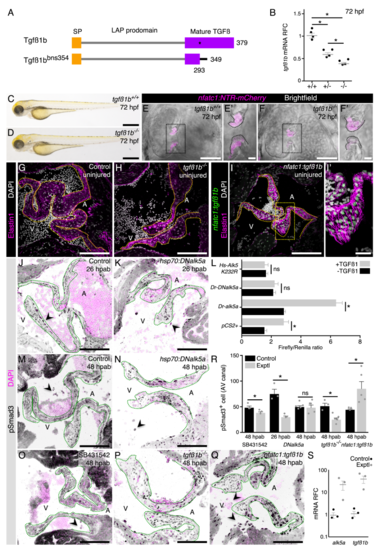
Figure S4. Validation of the TGFß signaling manipulation tools, related to Figure 4.(A) Tgfß1b wild-type and mutant proteins. (B) tgfß1bmRNA relative fold change (RFC)in 72 hpf wild-type, heterozygous and homozygous mutant larvae. (C-F’) No gross morphological defects are detected in mutant larvae (C, D) and their heart also appears unaffected (E-F’). (G-I’) Uninjured adult valves of control (G; n=8), tgfß1b mutant (H; n=4), and nfatc1:tgfß1b overexpression line (I, I’; n= 4) appear morphologically similar. (J-K) pSmad3 detection to determine the levels of TGFß signaling activation at 26 hpab in control (J) and DNalk5a (K)fish. (L) In vitro luciferase assay of human HEK cells after transfection of wild-type or dominant negative zebrafish alk5a or dominant negative human ALK5in the presence/absence of TGFß1. (M-Q) pSmad3 detection at 48 hpab in control (M), after overexpression of DNalk5a (N), after SB431542 treatment (O), in tgfß1bmutants (P), and after overexpression oftgfß1b (Q). (R) Quantification of pSmad3+cells in the AV canal. (S) qPCR analysis of mRNA levels RFC of alk5a and tgfß1bin the overexpression lines. Plot values represent means ± SEM.(ns –not significant, *P<0.05 by Mann Whitney test). Dashed lines delineate the AV valve leaflets. SP –signaling peptide, LAP –latency associated peptide, A –atrium, V –ventricle. Exptl -Experimental. Scale bars: (C), (D) 500 μm, (E), (F) 50 μm, (E’), (F’) 10 μm, (G), (H), (I), (J), (K), (M-Q) 100 μm, (I’) 20 μm.
|
