
Figure 6
- ID
- ZDB-FIG-210512-56
- Publication
- Sofou et al., 2021 - Bi-allelic VPS16 variants limit HOPS/CORVET levels and cause a mucopolysaccharidosis-like disease
- Other Figures
- All Figure Page
- Back to All Figure Page
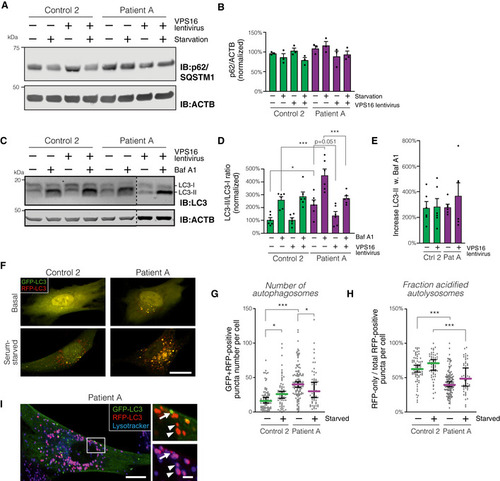
Analysis of p62/SQSTM1 levels in patient and control fibroblasts transduced with control or Summary quantification of (A), normalized to actin (ACTB) and expressed as % of controls ( Analysis of LC3 isoforms in serum‐starved fibroblasts transduced with control or Quantification of LC3‐II, normalized to levels of LC3‐I, actin and expressed as % of controls ( Autophagic flux, calculated as the relative increase in LC3‐II ratios upon addition of Baf A1 (data from D; Analysis of autophagosome numbers in fibroblasts transfected to express mRFP‐GFP‐LC3. (F) Representative confocal micrographs (optical sections) of fibroblasts imaged live under basal or serum‐starved conditions. Scale bar, 20 μm. (G and H) Quantification of autophagosomes, defined as green + red puncta (G) and autophago‐lysosomes, calculated as the number of red (but not green) puncta divided by the total number of puncta. Colored horizontal bars denote median values and whiskers 5 and 95 percentiles ( Data information: Bar graphs represent data as mean ±SEM. Statistical comparisons between the indicated groups by one‐way ANOVA with Holm–Sidak’s multiple comparisons tests. * |