|
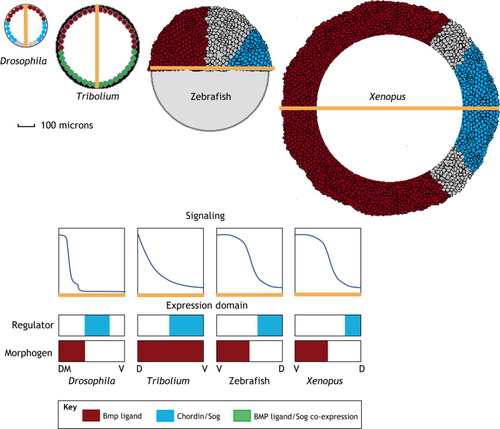
Signaling gradient profiles and expression domains of BMP patterned embryos. Top schematics show Dpp and Sog expression domains in the Drosophila embryo (240 μm; transverse section). Dpp expression domain and co-expression of Dpp and Sog in the Tribolium castaneum embryo (480 μm; transverse section). Expression domains of bmp ventrally and chordin dorsally in the zebrafish embryo (700 μm; late blastula) and the Xenopus embryo (1.2 mm; early gastrula, transverse section). Lower schematics show qualitative graphs of BMP signaling gradients and the expression domains for the morphogen and negative regulator. The yellow x-axis in the signaling graphs corresponds to the yellow line in the images of the top schematic. D, dorsal; DM, dorsal midline; V, ventral.
|