
Fig. 2
- ID
- ZDB-FIG-210413-42
- Publication
- Dietrich et al., 2021 - Skeletal biology and disease modeling in zebrafish
- Other Figures
- All Figure Page
- Back to All Figure Page
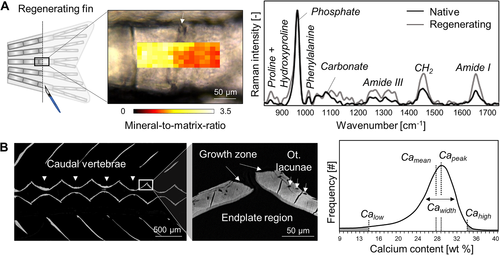
Assessment of matrix composition in zebrafish bone. (A) Raman spectroscopy allows mapping the mineral‐related and protein‐related properties of regenerating caudal fin bone (here, mineral‐to‐matrix ratio at 7 dpa) proximal and distal to the amputation plane (arrow). In the Raman spectra of regenerating parts (gray curve), protein‐related peaks including amide I, amide III, and hydroxyproline, are more pronounced in respect to the mineral‐related phosphate peak, reflecting a lower mineral‐to‐matrix ratio compared to native bone tissue (black curve). (B) qBEI can be used to assess the mineral density distribution in the zebrafish skeleton (here: sagittal plane of the vertebral column and close‐up of the endplate region). A histogram generated from calibrated pixel intensities within a region of interest allows extracting the Camean, Capeak, and Cawidth, as well as areas with Calow and Cahigh. Cahigh = high degree of mineralization; Calow = low degree of mineralization; Camean = mean Ca content; Capeak = peak Ca content; Cawidth = heterogeneity of the Ca distribution; dpa = days post amputation; qBEI = quantitative backscattered electron microscopy. |