|
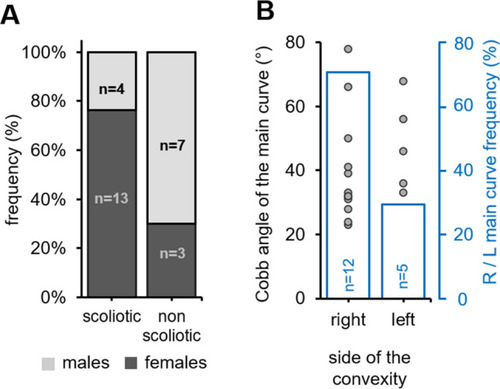
cfap298tm304 mutants exhibit a sexual and a right convexity bias for scoliosis development. (A) Stacked histogram showing the distribution of scoliotic and non-scoliotic phenotypes (frequency, %) in the analyzed cohort according to the gender (males: light grey, females: dark grey). Spinal curves were more prevalent in females (dark grey). (B) Distribution of the Cobb angle of the main curve in cfap298tm304 scoliotic fish according to the side of the convexity in the frontal plane (right versus left, grey points; each point represents a single fish). The frequency of the convexity of the main curve is represented in blue. Note that most of the curves are biased to the right side (12 out of 17 fishes).
|