FIGURE

Fig. 7

ID
ZDB-FIG-210403-19
Publication
Wang et al., 2021 - NOX5 is expressed aberrantly but not a critical pathogenetic gene in Hirschsprung disease
Other Figures
All Figure Page
Back to All Figure Page
Fig. 7

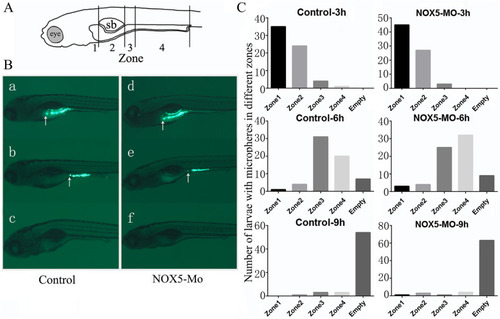
To evaluate intestinal transit at the population level, we categorized individuals within a population based on the location of tracer in the gastrointestinal tract. a Regions of the gut are divided to 4 zones based on anatomical landmarks. Zone 1 is the region of the intestinal bulb rostral to the swim bladder. Zone 2 is the region of the intestinal bulb ventral to the swim bladder. Zone 3 is the junction between the intestinal bulb and the mid intestine. Zone 4 consists of the mid- and posterior intestine. e, eye; sb, swim bladder. b Larvae were scored as zone 1, zone 2, zone 3, zone 4 and empty based on the anterior extent of tracer in the gastrointestinal tract (arrow). c Bar graphs representing the transit profile of a population of 7 dpf larvae at 3 h, 6 h, 9 h of transit time. Data are represented as the number of larvae classified into each zone category based on visual analysis of live larvae at the time specified. The difference of transit profiles of all time points between two groups show no statistically significant (P > 0.05)

Expression Data

Expression Detail
Antibody Labeling
Phenotype Data
Fish:
Knockdown Reagent:
Observed In:
Stage: Days 7-13

Phenotype Detail
Acknowledgments
This image is the copyrighted work of the attributed author or publisher, and ZFIN has permission only to display this image to its users. Additional permissions should be obtained from the applicable author or publisher of the image. Full text @ BMC Pediatr