
Fig. 3
- ID
- ZDB-FIG-210323-7
- Publication
- Sbragaglia et al., 2020 - Size-selective mortality induces evolutionary changes in group risk-taking behavior and the circadian system in a fish
- Other Figures
- All Figure Page
- Back to All Figure Page
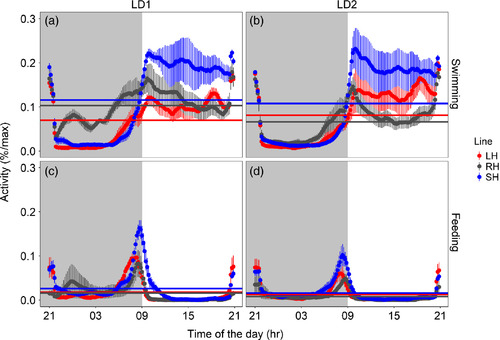
Mean waveforms (time scale 24 hr) for swimming (a, b) and self‐feeding (c, d) activity of zebrafish shoals are expressed as percentage of the maximum during the first (LD1: days 1–15) and second (LD2: days 22–36) light–dark trial. Each point represents the 10‐min binned mean across all the experimental days in LD1 and LD2 for all the groups. The different colours represent the selection lines: red for large‐harvested (LH; N = 6) grey for control (RH; N = 6) and blue for small‐harvested (SH; N = 5). The horizontal lines represent the midline estimating statistic of rhythm as reported in Table 1. The vertical lines represent the standard error (N between 75 and 90). Grey shadowed areas represent the dark hours (lights on is at time of the day = 09:00) |