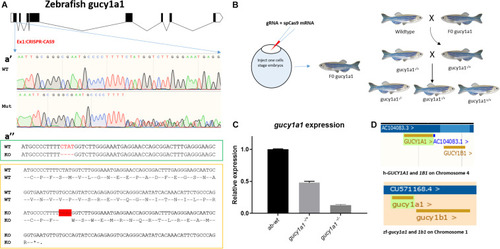
(A) Schematic of zebrafish gucy1a1 gene presenting all the exons in box forms and introns in the form of connecting lines, a’ showing sequencing result comparison of zebrafish wild-type allele (WT) vs. mutant (Mut) at gRNA target site on gucy1a1 gene exon 1, a” (in the green box) highlights 4 base pair deletion (highlighted as red dashes) at the mRNA level in the knockout zebrafish compared to the wild types, and a” (in the yellow box) shows the deletion of 4 base pair leading to premature stop codon at the amino acid level after 16 amino acids. (B) Schematic of gRNA + spCas9 mRNA in one-cell stage zebrafish embryos leading to identification of F0 founder fish, which were out crossed with AB wild-types following which heterozygotes were identified and in crossed. (C) mRNA relative expression of gucy1a1 gene was observed significantly reduced in the gucy1a1+/– (±50%) and gucy1a1– /– (±90%), error bars represent ±SD. (D) Schematic represents the conserved genomic positioning of both gucy1a1 and gucy1b1 genes in human and zebrafish genome, screen shots taken from Ensemble genome browser.
|
