
FIGURE
Fig. 4
- ID
- ZDB-FIG-210318-11
- Publication
- Kawasaki et al., 2021 - Coevolution of enamel, ganoin, enameloid, and their matrix SCPP genes in osteichthyans
- Other Figures
- All Figure Page
- Back to All Figure Page
Fig. 4
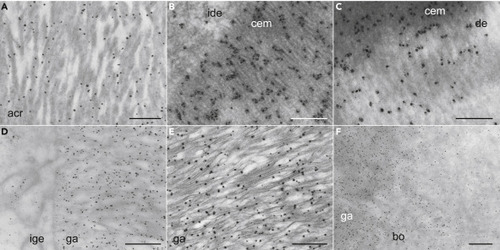
(A–F) TEM IHC analysis of gar Scpp5 in acrodin (A), collar enamel near IDE cells (B), collar enamel near dentine (C), ganoin near IGE cells (D), a middle portion of ganoin (E), and ganoin near bone (F). Dark dots show the distribution of Scpp5. Scale bar, 500 nm (A, D, E, and F) or 200 nm (B and C). See the legend of Figure 2 for abbreviations and Figure S2C for negative controls. |
Expression Data
Expression Detail
Antibody Labeling
Phenotype Data
Phenotype Detail
Acknowledgments
This image is the copyrighted work of the attributed author or publisher, and
ZFIN has permission only to display this image to its users.
Additional permissions should be obtained from the applicable author or publisher of the image.
Full text @ iScience