
FIGURE
Figure 2
- ID
- ZDB-FIG-210301-45
- Publication
- Daponte et al., 2021 - Appendage Regeneration in Vertebrates: What Makes This Possible?
- Other Figures
- All Figure Page
- Back to All Figure Page
Figure 2
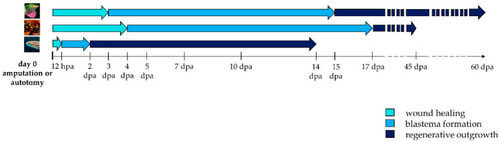
Timeline activation of wound healing, blastema formation and regenerative outgrowth during appendage regeneration in vertebrates. Arrows indicate the duration of each regenerative step in lizard, salamander, and zebrafish. Hpa: hours post-amputation; dpa: days post-amputation. |
Expression Data
Expression Detail
Antibody Labeling
Phenotype Data
Phenotype Detail
Acknowledgments
This image is the copyrighted work of the attributed author or publisher, and
ZFIN has permission only to display this image to its users.
Additional permissions should be obtained from the applicable author or publisher of the image.
Full text @ Cells