
Figure 4
- ID
- ZDB-FIG-210301-32
- Publication
- Head et al., 2021 - Vitamin E Deficiency Disrupts Gene Expression Networks during Zebrafish Development
- Other Figures
- All Figure Page
- Back to All Figure Page
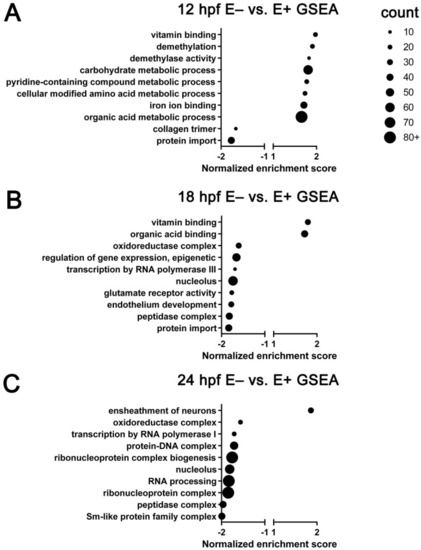
Gene ontology terms enriched by gene set enrichment analysis of all expressed genes. GO annotations associated with all genes (n = 22,796) pre-ranked, analyzed by time (12, 18, 24 hpf) and organized by normalized enrichment score. Top 10 significant (FDR < 0.25) GO terms are separated by expression at (A) 12 hpf, (B) 18 hpf and (C) 24 hpf. Approximate number of genes found enriched in each term indicated by dot size. Positive enrichment score indicates increased expression in E– relative to E+ embryos, negative enrichment score indicates decreased expression in E– relative to E+ embryos. Normalized enrichment score automatically computed with enrichment and adjusted p-value by WebGestalt. |