|
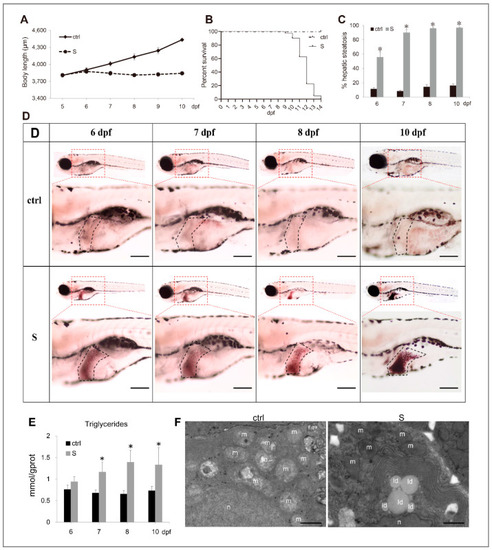
Characterization of starvation-induced hepatic steatosis in zebrafish larvae. (A) The depiction of growth performance in the control and starved larvae from 5 to 10 dpf. (B) The survival curve of the control and starved larvae was depicted by Kaplan-Meier assay. (C) Percentages of control and starved larvae with hepatic steatosis at 6, 7, 8, and 10 dpf. (D) Representative images of whole-mount Oil Red O (ORO) staining labelled the neutral lipids in larval liver at 6, 7, 8, and 10 dpf. The black dotted box labels the liver of zebrafish larvae. Bars = 200 μm. (E) Hepatic triacylglycerol (TAG) levels in the control and starved larvae from 6 to 10 dpf were determined. (F) Electron micrographs of hepatocytes from the control and starved larvae. Id: lipid droplets; m: mitochondria; n: cell nucleus. Bars = 10 μm. * indicates significant differences (p < 0.05).
|