Figure 1—figure supplement 3.

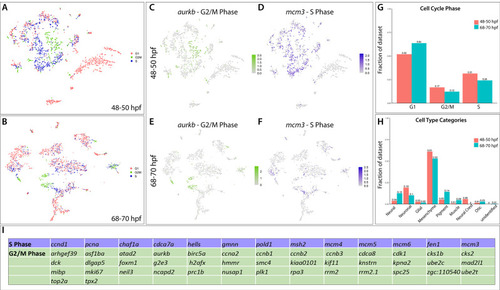
Major cell type categories and cell cycle distributions of the scRNA-seq datasets.

(A,B) tSNE plots summarizing the G1, S, and G2/M phase cell cycle phase occupancies of the cells in the 48–50 and 68–70 hpf time points, respectively. (C,E) A tSNE plot depicting the expression of aurkb, a G2/M phase marker, within the 48–50 and 68–70 hpf datasets, respectively. Relative expression levels are summarized within the color keys, where color intensity is proportional to expression level of each gene depicted. (D,F) A tSNE plot depicting the expression of mcm3, a S phase marker, within the 48–50 and 68–70 hpf datasets, respectively. Relative expression levels are summarized within the color keys, where color intensity is proportional to expression level of each gene depicted. (G) Bar graphs summarizing the cell cycle phase occupancies, as a fraction of cells within the total datasets for each time point. (H) Bar graphs summarizing the major cell type categories, as a fraction of cells within the total datasets for each time point. (I) Table summarizing the cell cycle genes used to demarcate cell cycle phase occupancy categories within the scRNA-seq datasets.

Expression Data

Expression Detail
Antibody Labeling
Phenotype Data

Phenotype Detail
Acknowledgments
This image is the copyrighted work of the attributed author or publisher, and ZFIN has permission only to display this image to its users. Additional permissions should be obtained from the applicable author or publisher of the image. Full text @ Elife