
FIGURE
Fig. 5
- ID
- ZDB-FIG-210217-75
- Publication
- Robles et al., 2020 - The zebrafish visual system transmits dimming information via multiple segregated pathways
- Other Figures
- All Figure Page
- Back to All Figure Page
Fig. 5
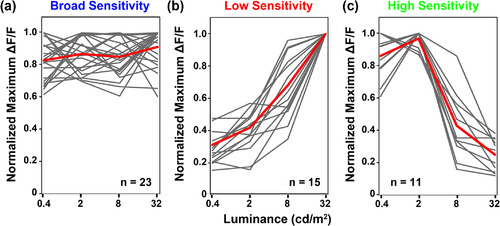
(a–c) Photosensitivity tuning curves for OFF retinal ganglion cells (OFF‐RGCs) detected in tectum of larva used in Figure 4. Individual region of interest (ROI) responses are shown in gray, average of these traces is shown in red. Data are presented as peak ∆F/F normalized to the maximum value for each RGC ROI in any of the trials. Data represents 59 ROIs detected in three larvae. Note diversity of responses within each functional class |
Expression Data
Expression Detail
Antibody Labeling
Phenotype Data
Phenotype Detail
Acknowledgments
This image is the copyrighted work of the attributed author or publisher, and
ZFIN has permission only to display this image to its users.
Additional permissions should be obtained from the applicable author or publisher of the image.
Full text @ J. Comp. Neurol.