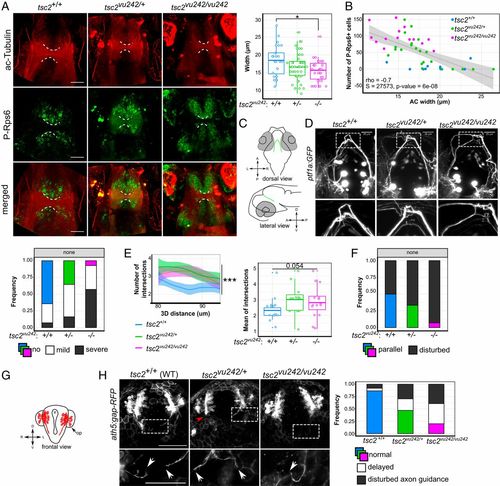
tsc2vu242vu/242 exhibit WM dysconnectivity resulting from aberrant axon elongation. (A) Representative horizontal optical sections through tsc2vu242 brains that were double-immunostained with anti–acetylated-Tubulin (ac-Tubulin; red) and anti–P-Rps6 (green) antibodies that show the AC (dashed lines) at 7.5 days post fertilization, together with the quantification of the width of the AC [F = 4.053, P = 0.0202; P = 0.011 for tsc2vu242/vu242 vs. tsc2+/+ (Dunnett’s test)]. (Scale bars, 30 μm.) (B) Correlation analysis of the number of P-Rps6–positive cells in the brain and the width of the AC, showing negative Spearman correlation and genotype clustering. (C) Schematic diagram of the localization of ptf1a:GFP-positive neurons in the posterior tuberculum that extend their axons dorsally and cross the brain midline through the posterior commissure. (D) Representative confocal images of a dorsal view of ptf1a:GFP-positive axons that show axonal tract fasciculation at the midline. The frequency of various ptf1a:GFP axonal phenotypes with various severity was quantified. (Scale bar, 25 μm.) (E) Sholl analysis of ptf1a:GFP-positive axon bundles at the midline of the tsc2vu242 brains, including the number of intersections over the 3D distance from the soma [regression curves with confidence intervals; F = 23.84, P = 7.4 × 10⁻¹¹; P = 2.3 × 10⁻⁶, tsc2vu242/vu242 vs. tsc2+/+ (Dunnett’s test); n = 16 tsc2vu242/vu242, n = 13 tsc2vu242/+, n = 15 tsc2+/+] and the mean number of intersections with the data distribution. For tsc2+/+, the Sholl function converged on the value of 2 at a distance of 80 to 90 μm, representing two tracts that crossed the midline, one for each hemisphere. tsc2vu242/vu242 fish did not present this tendency, and the average number of axons at the midline was higher than in tsc2+/+. (F) Frequency of parallelization of ptf1a:GFP> tracts from each hemisphere in the posterior commissure in the brain in tsc2vu242 fish (n = 27 tsc2vu242/vu242, n = 31 tsc2vu242/+, n = 18 tsc2+/+). (G) Schematic diagram of the localization of ath5:gap-RFP-positive commissures in the brain in tsc2vu242 fish at 24 hpf. op, olfactory placodes; v, brain ventricle. (H) Representative confocal images of a frontal view of ath5:gap-RFP–positive neurons that show axon elongation (white arrows indicate axons) and the occurrence of various axonal phenotypes during olfactory medial tract development [genotype × phenotype: F = 8.677, P = 8.5 × 10⁻⁴; P = 0.077, tsc2vu242/vu242 vs. tsc2+/+ (Dunnett’s test); n = 18 tsc2vu242/vu242, nn = 60 tsc2vu242/+, n = 25 tsc2+/+]. (Scale bars, 100 μm.) *P < 0.05, ***P < 0.005.
|
