FIGURE

Figure 2

ID
ZDB-FIG-210117-43
Publication
de Latouliere et al., 2021 - MITO-Luc/GFP zebrafish model to assess spatial and temporal evolution of cell proliferation in vivo
Other Figures
(all 6)
All Figure Page
Back to All Figure Page
Figure 2

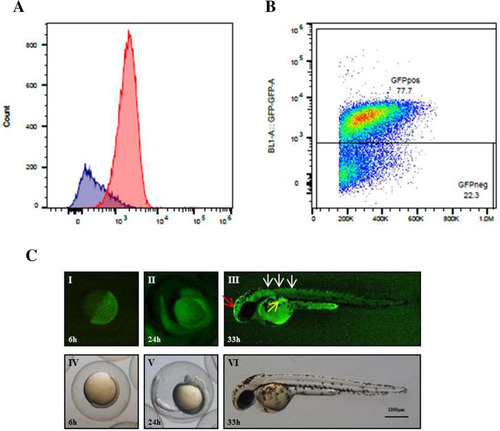
Fluorescence correlates with proliferation in MITO-Luc/GFP zebrafish line. (A) Flow cytometry analysis of cells dissociated from 200 zebrafish MITO-Luc/GFP 40 hpf embryos, previously incubated for 3 h with BrdU. Fixed cells were stained with anti-BrdU and anti-GFP antibodies. Histogram plot represents different BrdU accumulation in GFP positive (red) and negative (blue) cells. (B) GFP positive and GFP negative cells gating strategy. (C) GFP signal in 6 (I), 24 (II) and 33 hpf (III) embryos. GFP expression is almost ubiquitous throughout 6 and 24 hpf embryos (I,II). It is tissue specific in 33 hpf embryos being accumulated in the head (III, red arrow), proximal trunk (III, white arrows) and in developing fin (III, yellow arrow). Bright light images are shown (IV,V,VI).

Expression Data

Expression Detail
Antibody Labeling
Phenotype Data

Phenotype Detail
Acknowledgments
This image is the copyrighted work of the attributed author or publisher, and ZFIN has permission only to display this image to its users. Additional permissions should be obtained from the applicable author or publisher of the image. Full text @ Sci. Rep.