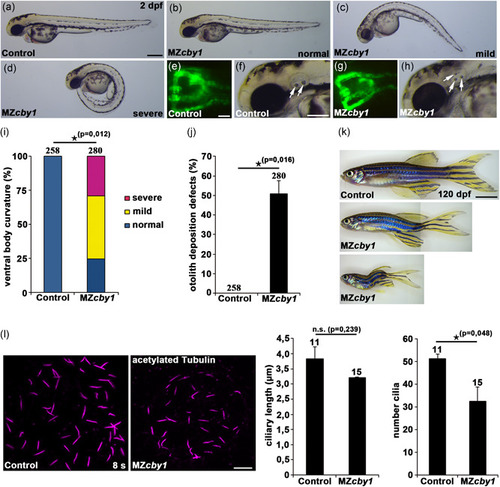
Zebrafish cby1 knockout mutants display ciliopathy‐related phenotypes. (a–h) Images of maternal‐zygotic (MZ) cby1 mutant embryos at 2 dpf display no or different degrees of ventral body curvature defects (b–d), no pronephric cyst formation as shown in a dorsal view with anterior to the top of a Tg(wt1b:EGFP) zebrafish embryo at 2 dpf (g), and prominent otolith deposition defects (white arrows) at 2 dpf (h) in comparison to the respective controls (a,e,f). Scale bars = 100 µm (a), 5 µm (e), and 50 µm (f). (i) Quantification of different degrees of ventral body curvature of 2dpf MZcby1 mutant embryos in comparison to the respective control. The number of individual embryos analyzed is indicated above each bar. (j) Quantification of otolith deposition defects of 2dpf MZcby1 mutant embryos in comparison to the respective control. The number of individual embryos analyzed is indicated above each bar. (k) Brightfield images of adult MZcby1 mutants at 120 dpf in comparison to the respective control. Scale bar = 500 µm. (l) Confocal images of the Kupffer's vesicle of control and MZcby1 mutant embryos at the stage of 8 somites (8s). Cilia were visualized by acetylated tubulin staining and ciliary length and number of cilia were quantified. Scale bar = 10 µm
|
