
FIGURE
Figure 2
- ID
- ZDB-FIG-201229-106
- Publication
- Boueid et al., 2020 - Rho GTPases Signaling in Zebrafish Development and Disease
- Other Figures
- All Figure Page
- Back to All Figure Page
Figure 2
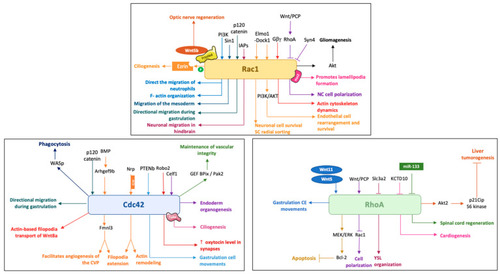
Schematic illustration of the main activities of Rac1, Cdc42 and RhoA in zebrafish and some of their regulators. NC, Neural Crest; SC, Schwann cell. |
Expression Data
Expression Detail
Antibody Labeling
Phenotype Data
Phenotype Detail
Acknowledgments
This image is the copyrighted work of the attributed author or publisher, and
ZFIN has permission only to display this image to its users.
Additional permissions should be obtained from the applicable author or publisher of the image.
Full text @ Cells