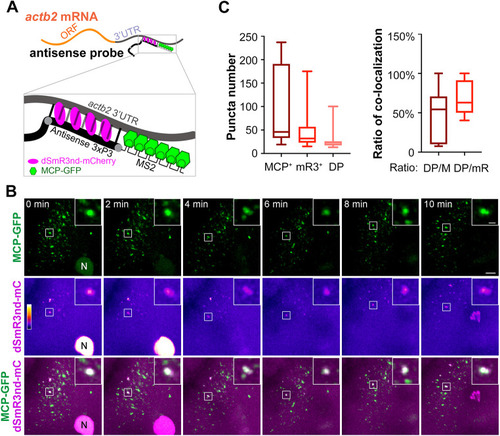
Dynamic tracking of endogenous actb2 mRNA simultaneously using mR3/dsRNA and MCP/MS2 systems. (A) Schematic of mRNA tracking with the two systems. The antisense actb2 3×P3-MS2 probe contains 3×P3, which is complementary to and forms dsRNA with 3′UTR, and six repeats of the MS2 aptamer, which can be recognized by the MCP-GFP fusion protein. (B) Time-lapse live images of dual-color-labeled RNA puncta. One-cell stage embryos were injected with 1 ng dSmR3nd-mCherry protein, 1 ng MCP-GFP protein and 300 pg antisense actb2 3×P3 MS2 probe and observed by confocal microscopy at the four-cell stage. Insets show magnification of boxed area. N, nucleus. See also Movie 6. (C) Number of fluorescent puncta (left) and ratio of co-localized puncta (right). Five embryos at 15 live imaging time points were used for calculation. DP/M, number of double-positive puncta/number of MCP-GFP-positive puncta; DP/mR, number of double-positive puncta/number of dSmR3nd-mCherry-positive puncta. Horizontal lines in the box plots show the median, boxes show the first to third interquartile ranges and whiskers represent the values outside the middle 50%. Scale bars: 10 µm; 2 µm (insets).
|
