
FIGURE
Figure 2
- ID
- ZDB-FIG-201212-2
- Publication
- Du et al., 2020 - Ethanol affects behavior and HPA axis activity during development in zebrafish larvae
- Other Figures
- All Figure Page
- Back to All Figure Page
Figure 2
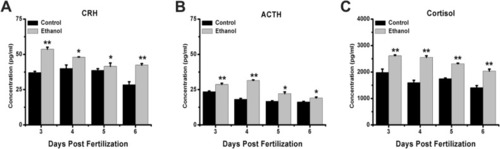
Effects of ethanol on HPA axis hormone levels in zebrafish larvae. Samples were taken at 3, 4, 5, and 6 dpf. |
Expression Data
Expression Detail
Antibody Labeling
Phenotype Data
| Fish: | |
|---|---|
| Condition: | |
| Observed In: | |
| Stage Range: | Protruding-mouth to Day 6 |
Phenotype Detail
Acknowledgments
This image is the copyrighted work of the attributed author or publisher, and
ZFIN has permission only to display this image to its users.
Additional permissions should be obtained from the applicable author or publisher of the image.
Full text @ Sci. Rep.