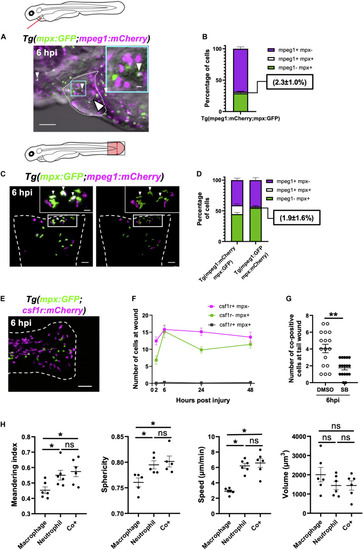
Immune cells co-positive for mpeg1 and mpx expression are neutrophils not macrophages. (A) Epifluorescence timelapse still overlaid on a brightfield image displaying a heart lasered Tg(mpx:GFP;mpeg1:mCherry) larva at 6 hpi with neutrophils (green), macrophages (magenta) and co-positive cells (white). White dotted line, pericardial region; cyan square, magnified region; small arrowheads, co-positive cells; and the large arrowhead, injury site. Scale bar = 100 μm. (B) Percentage of mpeg1:mCherry+ mpx:GFP-, mpeg1:mCherry+ mpx:GFP+ and mpeg1:mCherry-mpx:GFP+ cell populations on the injured ventricle at 6 hpi, n = 31 larvae, experimental n = 3. (C) LSFM 3D images of a transected tail fin at 6 hpi from a Tg(mpx:GFP;mpeg1:mCherry) larva displayed as a MIP (left) and surface render (right) where mpx:GFP signal is colored green and mpeg1:mCherry signal in magenta. Arrowheads, co-positive cells; dashed line, wound edge; and white boxes, magnified panels. Scale bar = 50 μm for main panel and 20 μm for the magnified panel. (D) Percentage of mpeg1:mCherry+ mpx: GFP-, mpeg1:mCherry+ mpx:GFP+ and mpeg1:mCherry-mpx:GFP+ cell populations at the tail wound of Tg(mpx:GFP;mpeg1:mCherry) and Tg(mpx:mCherry;mpeg1:GFP) larvae at 6 hpi, n = 24 larvae, experimental n = 3. (E) Epifluorescence image of a transected tail fin at 6 hpi from a Tg(mpx:GFP;csf1r:gal4;UAS:mCherry-NTR) [abbreviated to Tg(mpx:GFP;csf1r:mCherry)] larva, showing a lack of co-expressing cells. Scale bar = 100 μm. (F) Number of csf1r:NTR-mCherry+ mpx: GFP-, csf1r:NTR-mCherry-mpx:GFP+ and csf1r:NTR-mCherry+ mpx:GFP+ cells at the tail transection wound at 2, 6, 24, and 48 hpi, n = 16 larvae, experimental n = 3. (G) Number of mpx:GFP+ mpeg1:mCherry+ co-positive cells at the tail transection wound at 6 hpi following treatment with Cxcr1/2 antagonist SB225002 (5 μM) or DMSO (0.1%) vehicle, n = 17 larvae, experimental n = 3. Comparison between treatments was conducted using a t-test where ** p < 0.01. (H) Graphs comparing macrophages, neutrophils and co-positive cells on the basis of meandering index, sphericity, speed and volume derived from 3D analysis of LSFM timelapses from transected Tg(mpx:GFP;mpeg1:mCherry) tail fins between 1–2 hpi. Comparisons between cell types was performed by One-way ANOVA followed by a post hoc two-stage step-up method of Benjamini, Krieger and Yekutieli FDR correction, n = 6 larvae analyzed per group where * p < 0.05, ns, non-significant. Error bars, SEM for all graphs.
|
