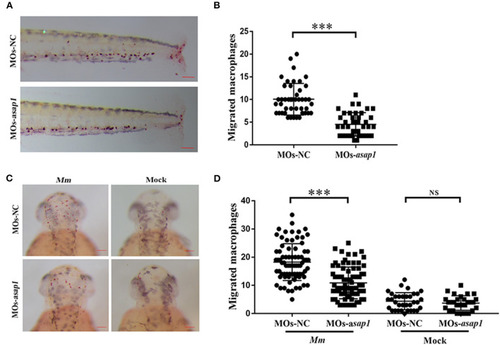
asap1 morphant macrophages exhibit impaired migration. (A) Representative light microscopy images of neutral red stained macrophages of transgenic morphants migrated to tailfin injury at 9 h post injury. (B) Numbers of recruited neutral red stained macrophages in the tailfin injury at 9 h post injury (scale bar, 100 μm); *** P < 0.001, P-values calculated by Student's unpaired t-test. n (MOs-NC group) = 45, n (MOs-asap1 group) = 40. (C) Representative light microscopy images of neutral red stained macrophages following hindbrain injection with Mm (left panels) or mock (right panels) into morphants at 9 h post infection. (D) Numbers of recruited neutral red stained macrophages in the hindbrain at 9 h post infection (scale bar, 100 μm); ***P < 0.001, NS, not significant, P-values calculated between two groups by Student's unpaired t-test. n (MOs-NC group/Mm) = 77, n (MOs-asap1 group/Mm) = 81, n (MOs-NC group/mock) =34, n (MOs-asap1 group/mock) =29. Each dot represents one larva. Mean ± SEM from two pooled independent experiments. MOs, morpholino oligonucleotide mixture. asap1 means asap1a and asap1b.
|
