FIGURE

Fig. 4

ID
ZDB-FIG-201105-4
Publication
Wang et al., 2020 - Directional divergence of Ep300 duplicates in teleosts and its implications
Other Figures
All Figure Page
Back to All Figure Page
Fig. 4

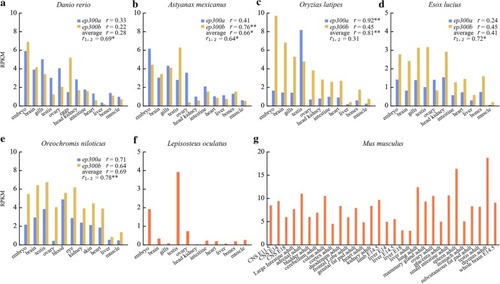
Tissue expression profiles of ep300 genes of different species. Four types of Pearson correlation coefficient (r) values were calculated: an r value following “ep300a” indicates the correlation between ep300a of a teleost and ep300 of L. oculatus; an r value following “ep300b” indicates the correlation between ep300b of a teleost and ep300 of L. oculatus; an r value following “average” indicates the correlation between average values of ep300a and ep300b of a teleost and ep300 of L. oculatus; r1,2 indicates the correlation between ep300a and ep300b of a teleost. A single asterisk (*) indicates that the correlation was significant (p < 0.05); two asterisks (**) indicate that the correlation was very significant (p < 0.01)

Expression Data

Expression Detail
Antibody Labeling
Phenotype Data

Phenotype Detail
Acknowledgments
This image is the copyrighted work of the attributed author or publisher, and ZFIN has permission only to display this image to its users. Additional permissions should be obtained from the applicable author or publisher of the image. Full text @ BMC Evol. Biol.