|
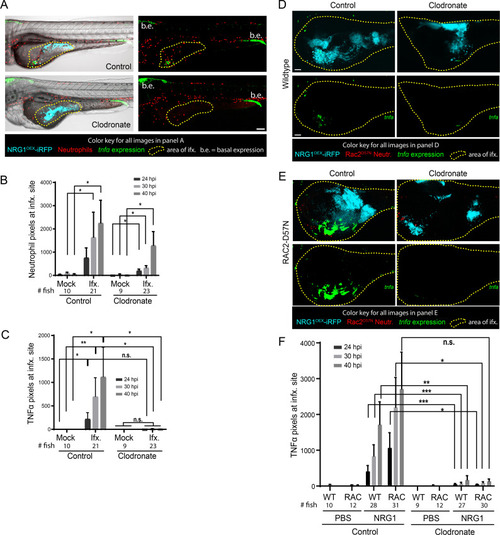
Macrophages are primarily responsible for TNFα production.Tg(lysC:Ds-Red)/Tg(tnfα:GFP) or Rac2-D57N/ Tg(tnfα:GFP) larvae with red fluorescent neutrophils and green fluorescence with tnfα expression were infected with a yeast-locked C. albicans as described. (A) Representative images of control and clodronate treated Tg(LysC:Ds-Red)/Tg(tnfα:GFP) larvae with functional neutrophils infected with a yeast-locked C. albicans at 40 hpi. Area in yellow outlines area of Candida growth in the yolk sac. Images were used to quantify neutrophil recruitment and tnfα expression. Scale bar = 100 μm. Markings are clarified in box below images. (B) and (C) Images were analyzed with ImageJ. (B) Neutrophil recruitment to the area of infection is not affected by macrophage ablation. Data pooled from 5 experiments, total fish used for quantification, left to right: n = 10, 21, 9, 23. Bars are the median with 95% confidence interval. Stats: Kruskall-Wallis with Dunn’s post-test. * p ≤ 0.05. (C) Larvae with ablated macrophages have an almost complete loss of tnfα expression. Bars are the means and SEM for ease of viewing. Stats: Mann-Whitney. * p ≤ 0.05, **p ≤ 0.01. (D) and (E) Representative images of control (left) and clodronate (right) treated Rac2-D57N x Tg(tnfα:GFP) sibling larvae infected with a yeast-locked C. albicans at 40 hpi. Area in magenta shows the yolk sac outline. Scale bar = 50 μm. (F) Larvae in which macrophages are ablated also have an almost complete loss of tnfα expression, which is independent of neutrophils. Pooled from 5 experiments. Stats: Kruskall-Wallis with Dunn’s post-test, * p ≤ 0.05, ** p ≤ 0.01, and bars are the mean and SEM.
|