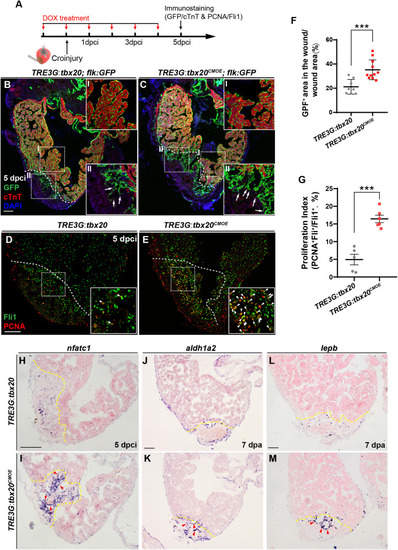
Myocardial tbx20 overexpression enhances endocardial activation and regeneration. (A) Schematic of experimental procedures for DOX treatment, cryoinjury and immunostaining experiments. (B,C) Representative confocal fluorescence images of heart sections from DOX-treated Tg(TRE3G:tbx20; flk:GFP) (B) and Tg(TRE3G:tbx20CMOE; flk:GFP) (C) zebrafish at 5 dpci immunostained for cTnT (red), GFP and DAPI. Boxed areas (I and II) indicate locations of the magnified insets, respectively. Box-I in (B,C) indicate the remote (uninjured) region of heart sections, and Box-II in (B,C) display the endocardial cells in injured site. Arrows in (B-II) and (C-II) point to the endocardial cell protrusions. (D,E) Representative confocal fluorescence images of heart sections from DOX-treated Tg(TRE3G:tbx20) (D) and Tg(TRE3G:tbx20CMOE) fish (E) at 5 dpci immunostained for Fli1 (green) and PCNA (red). Boxed areas indicate locations of the magnified insets. Arrowheads point to the Fli1+PCNA+ proliferating endocardial/endothelial cells. (F) Scatter plot showing the percentage of GFP+ area within the wound area of DOX treated Tg(TRE3G:tbx20) (n = 8) and Tg(TRE3G:tbx20CMOE) (n = 11) hearts at 5 dpci. Mean ± SEM, ***p < 0.001. (G) Dotted diagram indicates the proliferation indices of endocardial/endothelial cells with Fli1+PCNA+ signals in the border zone and injury site from 5 dpci Tg(TRE3G:tbx20) (n = 5) and Tg(TRE3G:tbx20CMOE) (n = 6) cardiac sections. Mean ± SEM, ***p < 0.001. (H–M) Representative images of ISH analysis for nfatc1(H,I), aldh1a2(J,K), and lepb(L,M) expression at 5 dpci or 7 dpa hearts from DOX-treated Tg(TRE3G:tbx20) and Tg(TRE3G:tbx20CMOE) fish. Dashed lines delineate the injured area. Red arrowheads indicate endocardium with nfatc1(I), aldh1a2(K) and lepb(M) signal in the injury site. Scale bar: 100 μm.
|
