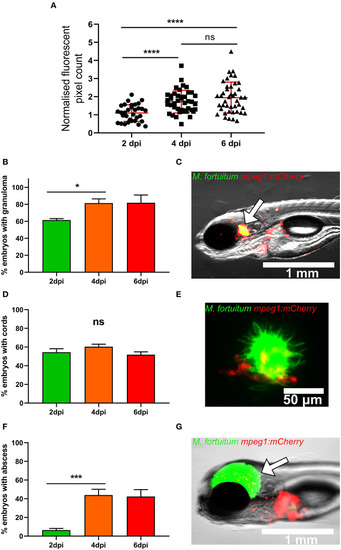
Zebrafish infected with Mycobacterium fortuitum recapitulate the hallmark features of other pathogenic mycobacteria. (A) Following infection mpeg1::mCherry zebrafish embryo at 30 h post-fertilization via caudal vein injection with 300 CFU of GFP-expressing M. fortuitum, bacterial burden was quantified using fluorescent pixel count (FPC determination using ImageJ software) at 2, 4, and 6 days post-infection. For each experiment, all groups were normalized against the 2 days post-infection group. Each datapoint represents an individual embryo. Error bars represent standard deviation. Statistical significance was determined by Student′s t-test. Plots represent a pool of 2 independent experiments containing approximately 20 embryos per group. (B) The granuloma formation kinetic in embryos following infection with M. fortuitum. Error bars represent standard deviation. Data shown is the merge of two independent experiments. Statistical significance was determined by Student′s t-test. (C) Representative image of a granuloma at 4 days post-infection. The white arrow highlights the granuloma. Scale bar represents 1 mm. (D) The kinetic of bacterial cord formation in zebrafish embryos following M. fortuitum infection. Error bars represent standard deviation. Data shown is the merge of two independent experiments. Statistical significance was determined by Student′s t-test. (E) Representative image of a bacterial corded M. fortuitum aggregate surrounded by recruited macrophages at 4 days post-infection. Note the sheer size of the bacterial aggregate in comparison to the smaller macrophages. Green represents M. fortuitum, while red represents macrophages. Scale bar represents 50 μm. (F) The kinetic of abscess formation in zebrafish embryos infected with M. fortuitum. Error bars represent standard deviation. Data shown is the merge of two independent experiments. Statistical significance was determined by Student′s t-test. (G) Representative image of an M. fortuitum abscess at 4 days post-infection. The white arrow highlights the abscess. Green represents M. fortuitum, while red represents macrophages. Scale bar represents 1 mm. *P ≤ 0.05, ***P ≤ 0.001, ****P ≤ 0.0001.
|
