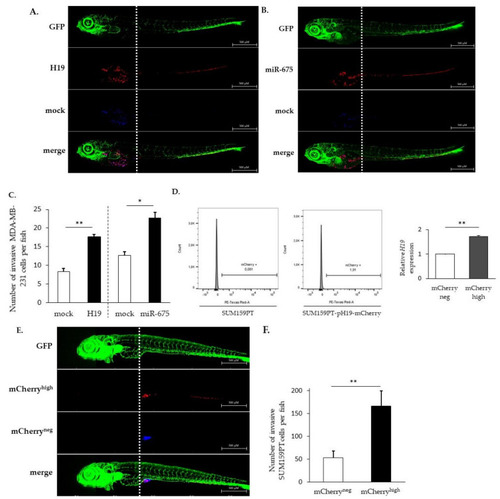
H19 and miR-675 both promote cancer cell invasion in vivo. (A) Invasive capacities of MDA-MB-231 stably overexpressing H19 and the control, stained with lipophilic tracers, in transgenic zebrafish. Fluorescent pictures were captured using automated image acquisition software. (B) Invasive capacities of MDA-MB-231 stably overexpressing miR-675 and the control, stained with lipophilic tracers, in transgenic zebrafish. Fluorescent pictures were captured using automated image acquisition software. (C) Quantification of invasive cells per zebrafish. (D) mCherry protein fluorescence in SUM159PT transfected or not with pH19-mCherry plasmid. Fluorescence intensity is categorized in mCherryneg and mCherryhigh cellular subpopulations. Relative H19 expression in those subpopulations is figured. (E) Invasive capacities of mCherryneg and mCherryhigh cellular subpopulations, stained with lipophilic tracers, in transgenic zebrafish. Fluorescent pictures were captured using automated image acquisition software. (F) Quantification of invasive cells per zebrafish. For each experiment, forty embryos were used. *p < 0.05 and **p < 0.01.
|
