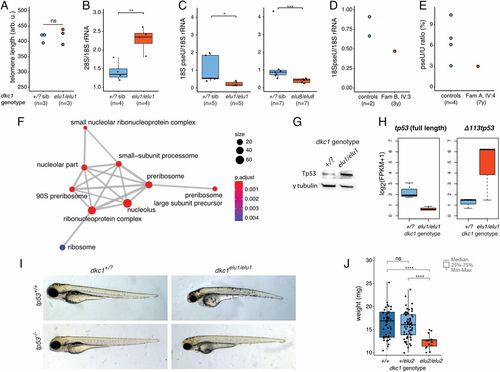
Ribosomal dysfunction in dkc1 zebrafish mutants due to defective pseudouridylation. (A) Telomere length is normal in dkc1elu1/elu1 larvae at 4 dpf as measured by flow-FISH (n = 3 pooled samples of 10 larvae each, P = 0.7). Arb. u., arbitrary units; ns, not significant. (B) The 28S/18S rRNA ratio is increased in 4-dpf dkc1elu1/elu1 larvae, suggesting impaired 18S rRNA processing (**P = 0.0033). (C and D) Immuno-Northern blot demonstrates a reduced pseudouridylation of 18S rRNA in dkc1elu1/elu1, dkc1elu8/elu8 4-dpf larvae (+/? vs. elu1/elu1: *P = 0.016, +/? vs. elu8/elu8: ***P = 0.00058) (C) and in the leukocytes of patient FamB IV:3 (D). (+/?: heterozygous or homozygous WT fish.) (E) The female with skewed X-inactivation shows a decreased pseudouridine (pseU)/U ratio in the leukocytes, as determined by HPLC-MS. (F) Gene Ontology analysis of differentially regulated genes from 36 hpf dkc1elu1/elu1 larvae demonstrates an up-regulation of genes associated with ribosome assembly and function. Size of the circles indicates the number of genes associated with certain terms, and color indicates the level of enrichment: red indicates high enrichment, and blue indicates low. P.adjust, adjusted P. (G) Western blot suggests the stabilization of Tp53 in the affected cells. (H) Transcriptomic analysis shows that the truncated, antiapoptotic tp53 isoform (Δ 113p53) is up-regulated in mutants, while the canonical, full-length, proapoptotic isoform shows decreased expression; measured as fragments per kilobase of exon model per million reads mapped. (I) The phenotype of the dkc1elu1/elu1 zebrafish mutants is Tp53-independent, as it is not rescued on a tp53− background. (J) Homozygous carriers of the missense (c.567_568insGTG) hypomorphic allele (dkc1elu2/elu2) are viable, but show significant growth retardation compared with their siblings (n = 130) (+/+ vs. elu2/elu2: ****P = 1.9 × 10⁻⁹; +/elu2 vs. elu2/elu2: ****P = 1.6 × 10⁻⁹). *P < 0.05; **P < 0.01; ***P < 0.001; ****P < 0.0001.
|
