
FIGURE
Figure 4
- ID
- ZDB-FIG-200803-9
- Publication
- Rassier et al., 2020 - Evaluation of qPCR reference genes in GH-overexpressing transgenic zebrafish (Danio rerio)
- Other Figures
- All Figure Page
- Back to All Figure Page
Figure 4
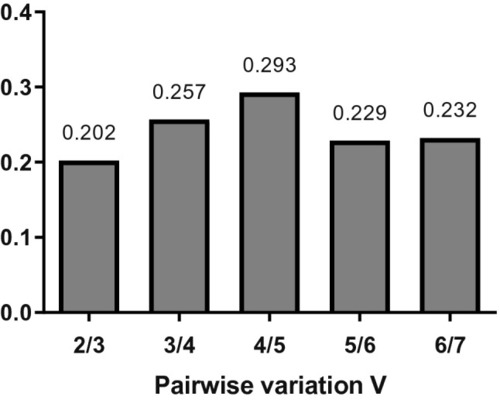
Graphical representation of the pairwise variation analysis. Y-axis represents V value and X-axis represents the number of reference genes used to normalize the reaction. The lowest value is found for 2/3 reference genes, what means that the addition of a third reference gene is superfluous to obtaining reliable results in experiments using non-transgenic and |
Expression Data
Expression Detail
Antibody Labeling
Phenotype Data
Phenotype Detail
Acknowledgments
This image is the copyrighted work of the attributed author or publisher, and
ZFIN has permission only to display this image to its users.
Additional permissions should be obtained from the applicable author or publisher of the image.
Full text @ Sci. Rep.