
Figure 4
- ID
- ZDB-FIG-200801-32
- Publication
- Yoshimatsu et al., 2020 - Fovea-like Photoreceptor Specializations Underlie Single UV Cone Driven Prey-Capture Behavior in Zebrafish
- Other Figures
- All Figure Page
- Back to All Figure Page
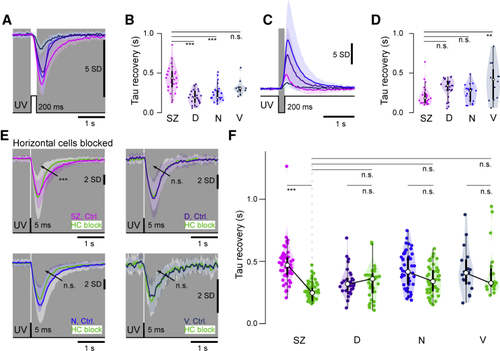
Temporal Tuning of UV Cones (A) Mean ± 1 SD responses to a 200-ms flash of light (6 × 10⁵ photon/s/μm2) from darkness (0 photon/s/μm2). (B) Box and violin plots of recovery time constants from (G). n = 29, 29, 23, and 13 for SZ, D, N, and V, respectively. (C and D) As in (A) and (B), but for an equivalent contrast dark flash. n = 27, 24, 19, and 13 for SZ, D, N, and V, respectively. ANOVA test ∗p < 0.02, ∗∗∗p < 0.0001 (H and J). n.s., not significant. (E) Mean ± 1 SD (shadings) calcium responses to a 5-ms light flash from darkness before (shades of purple) and after HC blockage using CNQX (green). (F) Quantification of recovery time constant after a 5-ms UV flash at 104 photons/cone. n = 51, 29, 46, and 17 for SZ, D, N and V, respectively for the control condition and n = 51, 32, 46, and 19 after HC block. ANOVA test ∗∗p < 0.01, ∗∗∗p < 0.001. n.s., not significant. |