|
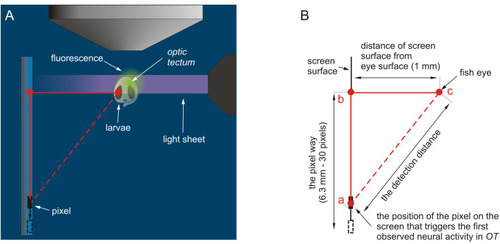
Pictures showing the zebrafish larva inside the glass capillary and the OLED screen inside the sample chamber of the microscope and the scheme for estimating the detection distance. (A) Top view. Note that the red triangle represents the relative position of the fish eye in relation to the screen and the position of the pixel on the screen, which induces the first neural signal in the OT (modified picture from the ZEISS Lightsheet Z.1 Light Sheet Fluorescence Microscopy for Multiview Imaging of Large Specimens). (B) A detailed scheme for designating the detection distance using the Pythagorean theorem. The red dotted line represents the length assumed to be the detection threshold distance.
|