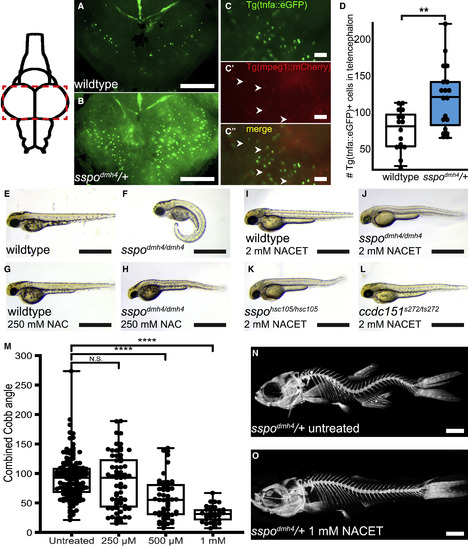
Chemical Suppression of CTD Phenotype Identifies NACET as a Potent Inhibitor of Severe Spinal Curve Progression (A–D) Evidence of neuroinflammation in scoliotic sspodmh4/+ fish. (A–C) Dorsal whole-mount images of brains dissected from juvenile (21-dpf) wild-type (A) and scoliotic sspodmh4/+ (B and C) zebrafish expressing the TgBAC(tnfa:eGFP) reporter, revealing an increase of TgBAC(tnfa:eGFP) activity in the telencephalon of sspodmh4/+ animals. TgBAC(tnfa:eGFP) expression does not co-localize with Tg(mpeg1:mCherry)-positive macrophages (arrows in C). Images were acquired using a Zeiss V16 Axio Zoom compound fluorescent microscope. Rostral is down. Scale bars represent 200 μm (A and B) and 50 μm (C). (D) Quantification of TgBAC(tnfa:eGFP)+ cells in the telencephalon of 21-dpf animals reveals a significant increase in sspodmh4/+ fish (∗∗p = 0.0069). (E–L) Lateral photos of 53-hpf zebrafish embryos demonstrating representative axial morphogenesis phenotypes. Wild-type (E) embryos exhibit a straight body axis. sspodmh4/dmh4 (F) embryos demonstrate characteristic curly tail down (CTD) phenotype. Treatment of sspodmh4/dmh4 mutants at 27 hpf with 250 mM NAC in 1% DMSO (H) can suppress CTD defects. Similarly, treatment with 2 mM NACET in 1% DMSO can suppress ventral tail curvatures in sspodmh4/dmh4 (J), sspohsc105/hsc105 (K), and ccdc151ts272/ts272 (L) mutant embryos. In contrast, treatment of wild-type embryos with 250 mM NAC (G) or 2 mM NACET (I) in 1% DMSO does not affect axis morphogenesis. Scale bars represent 1 mm. (M–O) NACET treatment of juvenile sspodmh4/+ zebrafish can suppress severe spinal curve progression. (M) Box and whisker plot for quantified combined Cobb angles measured in untreated control sspodmh4/+ fish (n = 138) and sspodmh4/+ fish treated with 250 μM (n = 65), 500 μM (n = 55), and 1 mM (n = 33) of NACET. A significant reduction in curve severity was observed for fish treated with both 500 μM and 1 mM NACET concentrations (∗∗∗∗p < 0.0001; two-tailed t test). (N and O) Representative images of Alizarin Red stained untreated (N) and 1 mM NACET-treated (O) sspodmh4/+ fish are shown. Scale bars represent 1 mm. See also Figure S4 and Tables S1 and S2.
|
