|
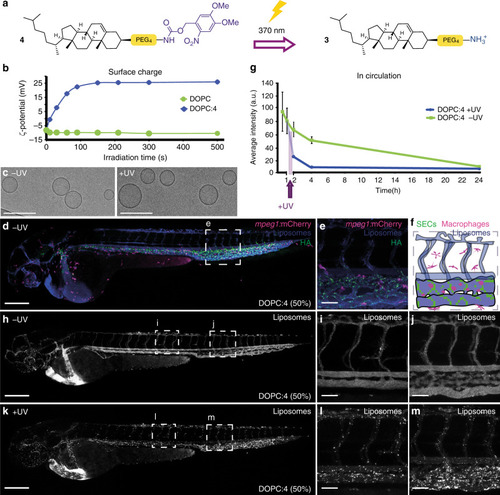
Photoswitching liposome surface charge in vitro and in vivo.a Chemical structure of 4 and its photolysis to 3. b Evolution of measured surface charge of DOPC:4 liposomes (1:1) as a function of UV (370 ± 7 nm, 202 mW cm−2) irradiation time. Note: batch-to-batch variation resulted in measured zeta potentials of DOPC:4 → 3 liposomes ranging from +20 to +35 mV. Data presented is representative of liposomes used in Fig. 3h–m. 100% DOPC control liposomes demonstrate surface charge of liposomes without photoactive lipids is unaffected by UV irradiation. c Cryo-TEM images of DOPC:4 before and after in situ irradiation (15 min, 370 ± 7 nm, 202 mW cm−2). Scale bar: 200 nm. See Supplementary Information Fig. 5 for low magnification cryoTEM images. d, e Whole embryo and tissue level views of DOPC:4 liposome biodistribution following co-injection with fluoHA in mpeg1:mCherry transgenic embryos (2 dpf). FluoHA is a specific in vivo marker of SECs and does not compete with liposome binding25. Liposomes (d, e) contained 1 mol% fluorescent lipid probe, DOPE-Atto633, for visualization. f Tissue level organization of macrophages and fluoHA-labelled SECs within the tail region of an mpeg1:mCherry embryo (2 dpf). g Quantification of DOPC:4 liposome levels in circulation based on mean liposome fluorescence intensity in the lumen of the DA at 0.5, 1, 2, 4 and 24 hpi (measure of centre: median; error bars: standard deviation); n = 6 (0.5 and 1 hpi) and n = 3 (2, 4 and 24 hpi) individually injected embryos per formulation per time point (see Fig. S7 for individual images). h–j Whole embryo and tissue level views of DOPC:4 liposome biodistribution in kdrl:GFP embryos, prior to UV irradiation, 1 hpi. k–m Whole embryo and tissue level views of DOPC: 4 → 3 liposome biodistribution in kdrl:GFP embryos, directly after in situ irradiation (15 min, 370 ± 7 nm, ~90 mW cm−2, ~2.4 J per embryo), ~1.5 hpi. Liposomes (h–m) contained 1 mol% fluorescent lipid probe, DOPE-LR, for visualization. Scale bars (d–m): 200 μm (whole embryo); 50 μm (tissue level).
|